>>> Here I have compiled some interesting datasets that I came up with/worked with, mainly for my small WIP
game.
Topography data
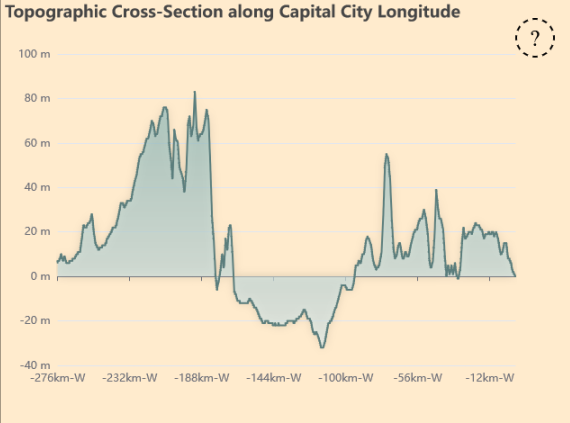
>>> Firstly, my favourite dataset, the Topographic Cross-Section of every country along the longitude of the
country.
This dataset provides an insight into the topographic makeup of the country, and sometimes can be used to
identifiy certain recognizeable
features of it. For example, here is the cross-section of Denmark:
>>> Here you can distinctly see the Samsø Bælt as well as an East-sitting capital, easily identifying the
country as Denmark.
>>> Now to create such a dataset, firstly one needs to have a list of all the capital cities and their
coordinates. After aquiring one such from the internet, begins the hard part.
I have downloaded the ETOPO-1 globar relief model with a resolution of about 2m from NOAA.
After this was downloaded, I compiled the OpenTopoData local API
with it, in order to be able to input
coordinates, and recieve the elevation.
I also injected my own code into the API to allow for detecting the country name on the coordinate - this is
to limit the topography lookup within the borders.
shapefile_path = '/app/geodata/ne_10m_admin_0_countries.shp'
world = gpd.read_file(shapefile_path)

def get_country(lat, lon):
    point = Point(lon, lat)
    match = world[world.contains(point)]
    if not match.empty:
        return match.iloc[0]['ADMIN']
    return "Unknown"


@app.route('/countryAtCoord')
def country_at_coord():
    lat = request.args.get('lat', type=float)
    lon = request.args.get('lon', type=float)

    if lat is None or lon is None:
        return jsonify({"error": "Please provide lat and lon parameters"}), 400

    country = get_country(lat, lon)
    print(country)
    return jsonify({
        "lat": lat,
        "lon": lon,
        "country": country
    })
>>> After initializing the API, the resulting code was this:
import requests
import numpy as np
import math

def createCrossection():
    with open('capitals.csv', 'r') as capitals:
        try:
            for line in capitals:
                try:
                    lat = round(float(line.split(',')[2]),5)
                    lon = round(float(line.split(',')[3]),5)
                    step = 0.001

                    lon_init = lon

                    unknown_tolerancy = 5000
                    current_unknown = 0
                    stepInKm = step * 111.32*math.cos(math.radians(lat))
                    initialCountry = requests.get('http://localhost:5000/countryAtCoord', params={'lat':lat,'lon':lon}).json()['country']
                    currentCountry = initialCountry
                    #go east
                    eastData = []
                    while(currentCountry==initialCountry or current_unknown<=unknown_tolerancy and currentCountry=='Unknown'):
                        lon+=step

                        currentCountry = requests.get('http://localhost:5000/countryAtCoord', params={'lat':lat,'lon':lon}).json()['country']
                        if currentCountry=='Unknown' or current_unknown>0 and currentCountry!=initialCountry:
                            current_unknown+=1
                        else:
                            current_unknown=0
                        elevation = round(float(requests.get('http://localhost:5000/v1/etopo1', params={'locations':str(lat)+','+str(lon)}).json()['results'][0]['elevation']),0)
                        eastData.append(elevation)
                    currentCountry = initialCountry
                    if current_unknown>0:
                        del eastData[-current_unknown:]
                    current_unknown=0
                    step=0.001
                    westData = []
                    lon = lon_init
                    #go west
                    while(currentCountry==initialCountry or current_unknown<=unknown_tolerancy and currentCountry=='Unknown'):
                        lon-=step
                        currentCountry = requests.get('http://localhost:5000/countryAtCoord', params={'lat':lat,'lon':lon}).json()['country']

                        if currentCountry=='Unknown' or current_unknown>0 and currentCountry!=initialCountry:
                            current_unknown+=1
                        else:
                            current_unknown=0

                        elevation = round(float(requests.get('http://localhost:5000/v1/etopo1', params={'locations':str(lat)+','+str(lon)}).json()['results'][0]['elevation']),0)
                        westData.insert(0,elevation)

                    if current_unknown>0:
                        westData=westData[current_unknown:]

                    fullList = westData+eastData
                    dw = (stepInKm*len(westData))*-1
                    de = (stepInKm*len(eastData))
                    distances = np.array(np.arange(dw, de, stepInKm))
                    csvFormElevation = ','.join(map(str, fullList))
                    csvFormDistances = ','.join(map(str, distances))
                    with open('crossection3.csv', 'a', newline='') as crossection:
                        crossection.write(initialCountry+','+csvFormElevation+'\n')
                        crossection.write(initialCountry+','+csvFormDistances+'\n')
                        crossection.close()
                except:
                    print(line.split(',')[0])
        except:
            print('oh no')
createCrossection()
>>> After this code has ran, I was left with a csv file with all the elevations across the east-west of a
country. The Unknow Tolerancy is designed to allow for strais and island nations to be represented properly.
The data then is passed over to the client, running through ApacheEcharts to graph into a visualized form.
Night-Light dataset
>>> Continuing with country data, I have also decided to create a dataset to somehow represent the country's
night lights.
Doing that is fairly difficult witout giving away the shape of the country, as this is still part of the
country guessing game.
>>> Firstly I found the desired dataset on an obscure website somewhere for the Earth Observation Group
through the Colorado School of Mines running a scuffed
version of Red Hat linux.
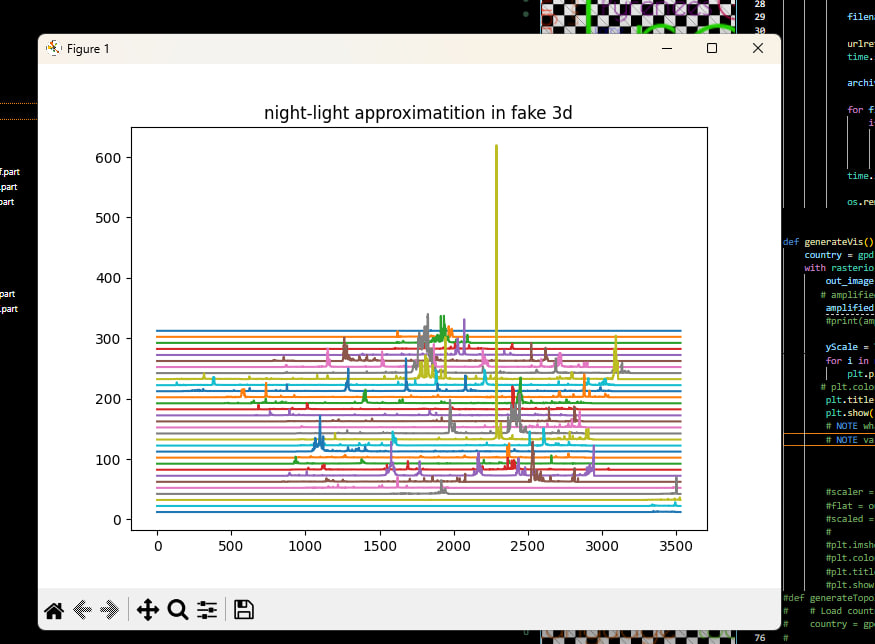
>>> Now having the VIIRS (Visible Infrared Imaging Radiometer Suite) dataset, I still was unsure as to how to approach it. A good visualization must
always be clear, but I also had the requirement to hide the country to some extent.
I decided to settle on a pseudo-3d chart design looking somewhat like this:
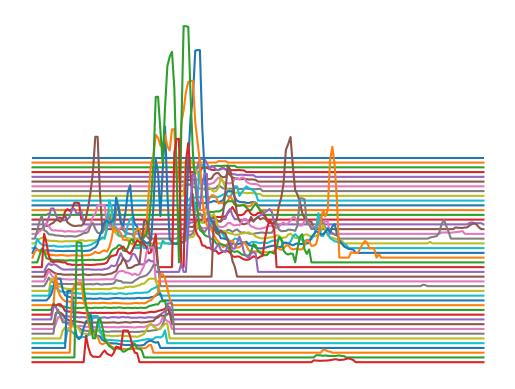
>>> This approach did lead to some extremely satisfying results, for example this chart of Guadeloupe:
>>> So much about the country's geography and development can be read from this. Now, to actually obtain
such a dataset, some manipulations have to be done.
Firstly, because the VIIRS dataset was a global spanning map, I had to apply a shape-mask of the country onto it so that only one country was isolated. To get
those shapemasks, I wrote the following python code:
def downloadShapefiles():
    with open('codes3.csv') as codes:
        for line in codes:
            try:
                country = line.split(',')[0]
                code = line.split(',')[1].replace('\n','')

                path = f'https://geodata.ucdavis.edu/gadm/gadm4.1/shp/gadm41_{code}_shp.zip'
                path2 = f'https://geodata.ucdavis.edu/gadm/gadm4.1/shp/gadm41_{code}_shx.zip'

                print(path)

                filename = 'countryShapes/'+country+'_'+code+'.zip'
                urlretrieve(path, filename)

                time.sleep(1)

                archive = zipfile.ZipFile(filename)
                n=0
                for file in archive.namelist():
                    if file==f'gadm41_{code}_0.shp' or file ==f'gadm41_{code}_0.shx':
                        n+=1
                        archive.extract(file, 'shapes/')
                        if n>=2:
                            archive.close()
                            break

                time.sleep(1)

                os.remove(filename)
            except:
                print('issue with ', line)
>>> Having now those files, I needed to apply a mask and from that mask read the light emission values:
def generateVis():
    directory = os.fsencode('shapes')

    for file in os.listdir(directory):
        filename = os.fsdecode(file)
        full_path = os.path.join(os.fsdecode(directory), filename)
        if filename.endswith('.shp'):
            country = gpd.read_file(full_path)
            country_name = getCountryNameFromCode(filename.split('_')[1])
            with rasterio.open("mainshapes/spanning.tif") as src:
                out_image, transferm = mask(src, country.geometry, crop=True)
                HEIGHT = math.log10(len(out_image[0]))*20

                yScale = math.floor(len(out_image[0])/HEIGHT) #the smaller the number the more lines
                shift=20
                print(HEIGHT)
                LENGTH = (len(out_image[0][0]))
                shift = LENGTH/HEIGHT
                mean = np.mean(out_image[0])
                mult = 3
                if mean < yScale:
                    mult = 5
                else:
                    mult = 3
                for i in range(math.floor(HEIGHT)):
                    array = removeOutliers(np.add(np.multiply(out_image[0][i*yScale], mult),0))
                    plt.plot(np.add(array, shift*(HEIGHT-i)))
                plt.axis('off')
                plt.savefig(f"NLVIS_LOG/{country_name}.png", bbox_inches='tight', transparent=True)
                plt.clf()
>>> The resulting plot you have already seen. The rest of the dataset can be found on the Github page for the project.
>>> Thank you for reading - Ilja Zaicevs.